library(PKPDsim)
library(clinPK)
library(dplyr)
library(tidyr)
library(ggplot2)
# remotes::install_github("mtennekes/cols4all")
library(cols4all)
cbpal <- c4a("kelly", 9) # color scheme for plots (colour-blind friendly)

# Make sure the following 9 models are installed, or adapt as appropriate.
models <- c(
  "pkvancojacqzaigrain",
  "pkvancokloprogge",
  "pkvancocolin",
  "pkvancocapparelli",
  "pkvancofrymoyer",
  "pkvancole",
  "pkvancoanderson",
  "pkvancodao",
  "pkvancogermovsek"
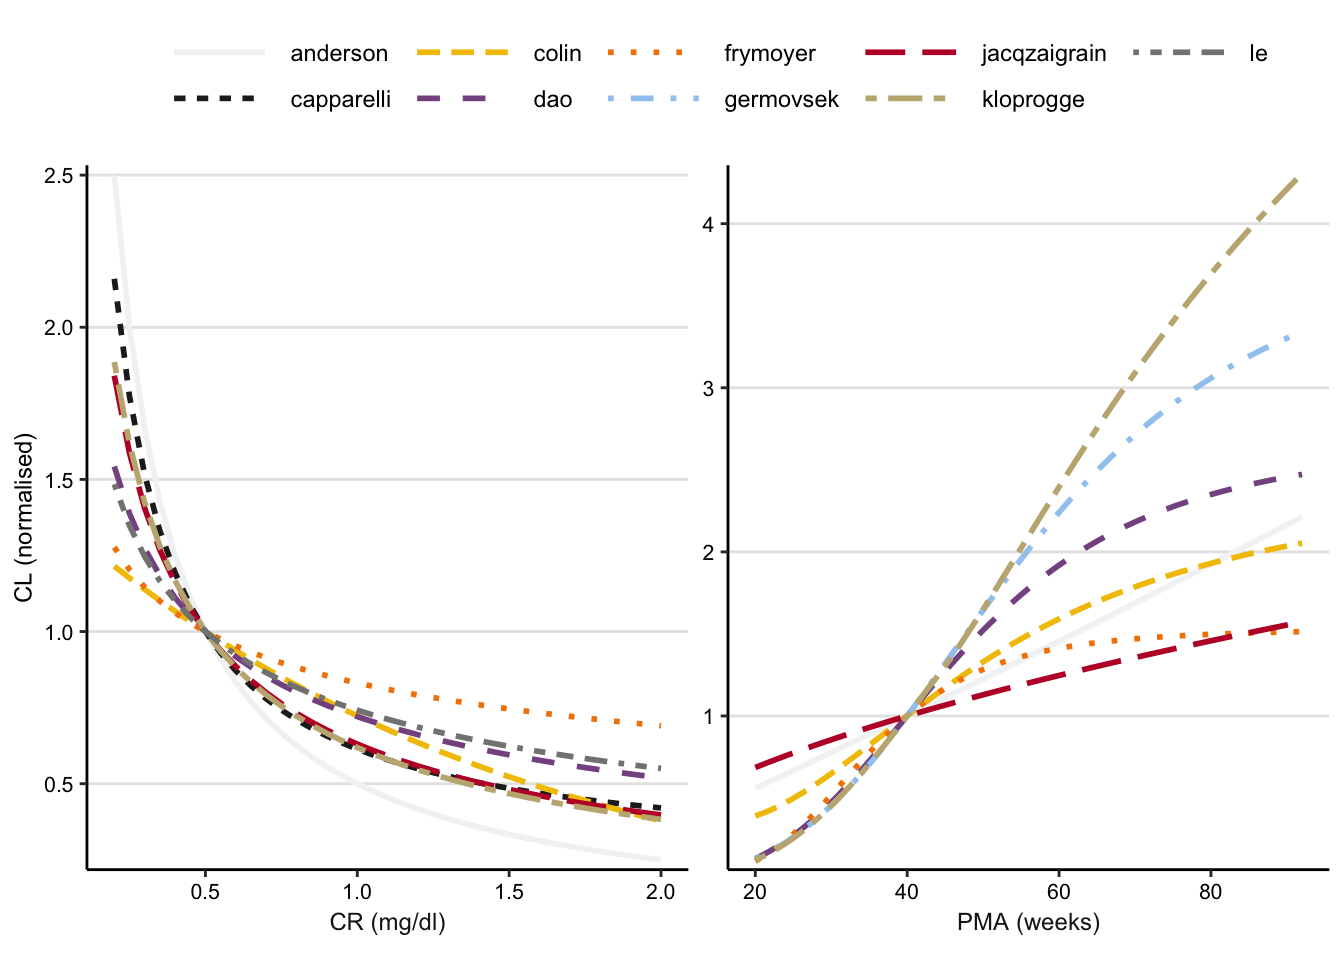
)Visualizing clearance differences between neonate PK models with clinPK and PKPDsim
clinPK
PKPDsim
Calculate clearance for a given post-menstrual age (PMA) or serum creatinine, holding constant all other covariates, for 9 different PK models.
# ------------------------------------------------------------------------------
# Define functions
# ------------------------------------------------------------------------------

# Function to load the information we need for simulation for each model
# model_lib: name of model library, eg "pkvancokloprogge"
# what: objects to load from the model package namespace
load_model_objects <- function(
  model_lib,
  what = c("model", "parameters")
) {
  suppressMessages( ## avoid message "the following objects are masked from ..."
    require(model_lib, character.only = TRUE)
  )

  mod_objects <- list()
  for(i in seq(what)) {
    mod_objects[[what[i]]] <- get(what[i], asNamespace(model_lib))()
  }
  mod_objects
}

# Calculate CL for a particular CR
# model_lib: name of model library, eg "pkvancokloprogge"
# crs: vector of creatinine values for which to calculate CL
CL_by_CR <- function(model_lib, crs){
  mod_obj <- load_model_objects(model_lib)
  covs <- list(
    SEX = new_covariate(1),
    WT = new_covariate(10),
    PMA = new_covariate(40),
    GA = new_covariate(36),
    AGE = new_covariate(4 * 7/365),
    HT = new_covariate(70),
    CL_HEMO = new_covariate(0),
    CR_ASSAY = new_covariate(0)
  )
  vapply(
    crs,
    function(x) {
      covx <- covs
      crcl <- suppressMessages(suppressWarnings(clinPK::calc_egfr(
        method = "schwartz_revised",
        sex = "male",
        weight = 10,
        height = 70,
        scr = x,
        age = 0.2
      )))
      covx$CR <- new_covariate(x)
      covx$CRCL <- new_covariate(crcl)
      calculate_parameters(
        mod_obj$model,
        mod_obj$parameters,
        covx
      )[["CLi"]]
    },
    FUN.VALUE = numeric(1)
  )
}


# Calculate CL for a particular PMA
# model_lib: name of model library, eg "pkvancokloprogge"
# pmas: vector of post-menstrual ages for which to calculate CL
CL_by_PMA <- function(model_lib, pmas){
  mod_obj <- load_model_objects(model_lib)
  modlib <- mod_obj$model_lib
  crcl <- suppressWarnings(suppressMessages(
    clinPK::calc_egfr(
      method = "schwartz_revised",
      sex = "male",
      weight = 10,
      height = 70,
      scr = 0.7,
      age = 0.2
    )
  ))
  covs <- list(
    CR = new_covariate(0.7),
    SEX = new_covariate(1),
    WT = new_covariate(10),
    HT = new_covariate(70),
    CRCL = new_covariate(crcl),
    CL_HEMO = new_covariate(0),
    CR_ASSAY = new_covariate(0)
  )
  vapply(
    pmas,
    function(x) {
      covx <- covs
      covx$PMA <- new_covariate(x)
      covx$GA <- new_covariate(pmin(x, 36))
      covx$AGE <- new_covariate(pmax((covx$PMA$value - covx$GA$value) / 7, 1))
      calculate_parameters(
        mod_obj$model,
        mod_obj$parameters,
        covx
      )[["CLi"]]
    },
    FUN.VALUE = numeric(1)
  )
}
# ------------------------------------------------------------------------------
# Run simulations
# ------------------------------------------------------------------------------
models_for_CR <- setdiff(models, "pkvancogermovsek")
models_for_PMA <- setdiff(models, c("pkvancole", "pkvancocapparelli"))
crs <- seq(0.2, 2, 0.05)
pmas <- seq(20, (40 + 52), 1)
# 1. Calculate CL at each value of covariate
cls_by_crs <- setNames(
lapply(
models_for_CR,
CL_by_CR,
crs
),
gsub("pkvanco", "", models_for_CR)
) %>%
as.data.frame() %>%
mutate(CR = crs)
cls_by_pmas <- setNames(
lapply(
models_for_PMA,
CL_by_PMA,
pmas
),
gsub("pkvanco", "", models_for_PMA)
) %>%
as.data.frame() %>%
mutate(PMA = pmas)
# 2. Normalize clearance to clearance at selected standard values
cls_cr05 <- cls_by_crs %>%
pivot_longer(-CR, names_to = "model", values_to = "CL") %>%
filter(CR == 0.5) %>%
select(model, cr05 = CL)
cls_by_crs_norm <- cls_by_crs %>%
pivot_longer(-CR, names_to = "model", values_to = "CL") %>%
left_join(cls_cr05, by = "model") %>%
group_by(model) %>%
mutate(CLn = CL/cr05) %>%
ungroup() %>%
mutate(model = gsub("_.*", "", model)) %>%
mutate(cov = "CR (mg/dl)") %>%
rename(value = CR)
cls_pma40 <- cls_by_pmas %>%
pivot_longer(-PMA, names_to = "model", values_to = "CL") %>%
filter(PMA == 40) %>%
select(model, pma40 = CL)
cls_by_pma_norm <- cls_by_pmas %>%
pivot_longer(-PMA, names_to = "model", values_to = "CL") %>%
left_join(cls_pma40, by = "model") %>%
group_by(model) %>%
mutate(CLn = CL/pma40) %>%
ungroup() %>%
mutate(model = gsub("_.*", "", model)) %>%
mutate(cov = "PMA (weeks)") %>%
select(model, cov, value = PMA, CLn)# ------------------------------------------------------------------------------
# Plot clearance as a function of covariate values
# ------------------------------------------------------------------------------
p <- bind_rows(cls_by_crs_norm, cls_by_pma_norm) %>%
ggplot() +
aes(x = value, y = CLn, color = model, linetype = model) +
facet_wrap(~cov, scales = "free", strip.position = "bottom") +
geom_line(size = 1) +
theme_classic() +
scale_color_manual(values = cbpal) +
ylab("CL (normalised)") +
theme(
legend.position = "top",
legend.title = element_blank(),
legend.key.width = unit(1.5, 'cm'),
panel.grid.major.y = element_line(colour = "grey90"),
axis.text = element_text(size = 8, color = 'black'),
axis.title = element_text(size = 9, color = 'black'),
axis.title.x = element_blank(),
plot.tag = element_text(size = 10, family = "Times"),
strip.text = element_text(size = 9),
strip.background = element_blank(),
strip.placement = "outside",
strip.text.x = element_text(margin=margin(b=5))
) +
scale_y_continuous(expand = c(0.01,0.01))
p